College Tuition Inflation: A Deep Dive Into the Soaring Cost of College Over the Past 60 Years

When the news broke earlier this year that inflation had reached a 40-year high, the story left out key points. The most common measure of inflation, the Consumer Price Index (CPI), doesn’t apply to the cost of a college education. In the field of higher education, the impact of inflation in the last few decades has already escalated far beyond the inflation value or rate of yearly change as it pertains to consumer goods.
Between 1960 and 2020, the CPI underwent an eight-fold increase. Over the same timeframe, measures of college tuition inflation saw a 14-fold increase that sent the costs of a college degree spiraling out of control.
Everyone knows that college is expensive, but most people do not know just how expensive, or just how much the cost has risen in a short time. Our exploration dives straight into the data of how college costs have ballooned over the decades and what these figures mean for students today.
College Tuition Inflation Case Studies: Increases in Cost of Attendance From 1960 to Today at Real Colleges and Universities
In 1960, it was possible to go to college-including not only tuition costs but also fees, room, and board)-for a nominal cost of under $2,000 per year, according to an article published by TIME that listed the costs of attendance at a sampling of 50 colleges that year.
Of course, $2,000 in 1960 is not equivalent to $2,000 today, thanks to inflation. In today’s dollars, that $2,000 cost in 1960 would be closer to $19,000. At the time, the Census Bureau reported that the median income for families was $5,600 (around $54,000 in today’s dollars).
The cost of a year’s worth of college education, with all of the living expenses, was still significant, amounting to a third of a family’s annual income in 1960. However, it is nowhere near the burden of the cost of college today.
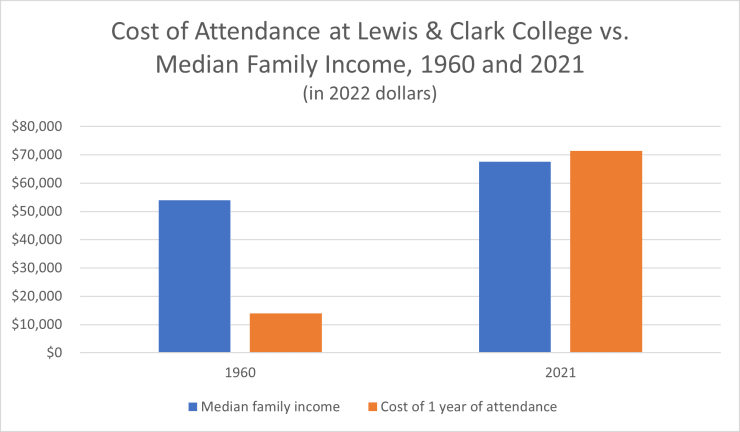
Lewis & Clark College Case Study: From One-Third the Median Household Income to More Than a Family Earns in a Year
In its 1960 article, TIME listed the price of a year at Lewis & Clark College in Portland, Oregon, as $1,450, or just shy of $14,000 in today’s dollars.
For the 2021 through 2022 academic year, Lewis & Clark College reported a rate of $57,404 in tuition and fees alone. Add in the costs of room (in a shared dorm) and board, and these costs amount to $71,350 for a single year of college. To put that in perspective, the Census Bureau reported a median household income of $67,521 in 2020.
What once cost about a third of the median family income for a year now costs more than what a family earns in a year.
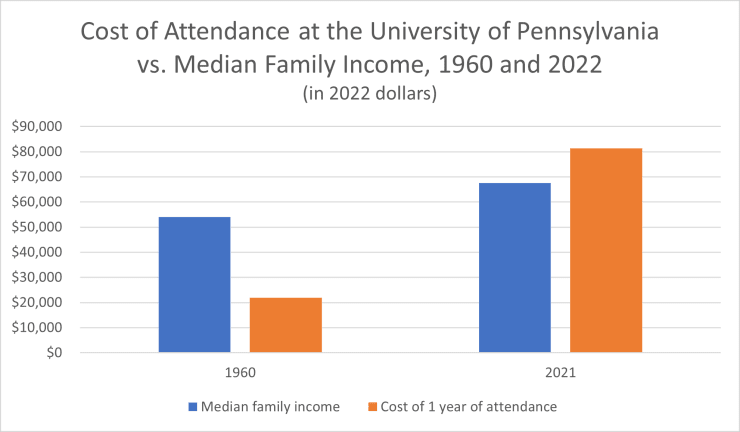
University of Pennsylvania Case Study: Current Costs Climb to More than 20% Above the Median Household Income
At the University of Pennsylvania, undergraduate students in 1960 paid unadjusted costs of $1,250 in tuition and $150 in general fees for a year of study. Including the $950 room and board expenses, the cost of attendance amounted to $2,350, or over $22,000 in today’s dollars.
The 2022-2023 cost of attendance at the University of Pennsylvania includes $56,212 in undergraduate tuition, $7,240 in fees, $11,754 in room, and $6,134 in board expenses, for a total of $81,340. That amounts to 20% more than the median household income ($67,521) as of 2020.
Why Students Today (and Over the Last Half a Century) Cannot Work Their Way Through College One Summer at a Time
In 1960, the cost of college was already on the rise. Gone were the days when a recent high school graduate really could work a summer job to pay the full cost of an entire year of study at a four-year college.
As the University of Missouri Library reported, the federal minimum wage in 1960 was $1 at this time in history. Assuming a 40-hour workweek (which had already been established two decades earlier), it would take 36 weeks of work to save up the money for one year of tuition, fees, room, and board at Lewis & Clark College, or almost a year to save up enough to study at a pricier school with a cost of attendance in the $2,000 range. To attend the University of Pennsylvania in 1960, a full-time minimum-wage worker would need to save up 58 weeks’ worth of their salary.
This once-feasible notion of working full-time in the summer to pay for a full year of college would only become even farther removed from reality as the years went on.
The average cost of tuition, fees, room and board for in-state undergraduate students at four-year schools (public and private) for the 2019-2020 school year was $28,775, according to the National Center for Education Statistics. At the current federal minimum wage of $7.25, a full-time (40-hour-per-week) worker would need to work more than 99 weeks-nearly two years-just to earn enough money to pay for college, not counting other expenses (like a place to live during those two years).
Students who choose to attend out-of-state schools or private institutions face an even more insurmountable financial burden. Among private (for-profit and non-profit) four-year institutions, the average cost for tuition, fees, room, and board was a staggering $45,932 for the 2019 through 2020 school year. Full-time minimum-wage workers would need to work more than three years just to come up with the cash to pay for one year of school (and that is not counting other expenses or income taxes).
The Ballooning Cost of College Through the Years
Let’s dig deeper into the National Center for Education Statistics data on the average cost of college attendance (tuition, fees, room, and board).
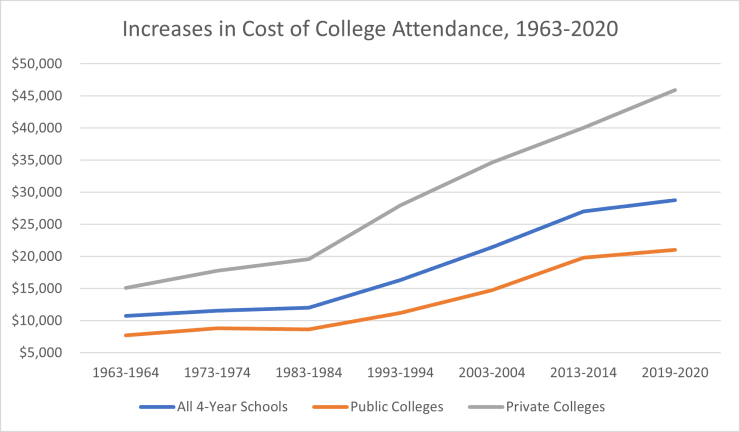
Between the 1963-1964 school year and the 2019-2020 school year, the cost of attending a four-year college has multiplied more than 2.5 times.
The cost of attendance at private colleges (as expressed in 2019 dollars) more than tripled, from $15,093 to $45,932. Even the traditionally affordable option of public colleges and universities increased more than 2.7 times, from $7,745 (again, in 2019 dollars) to $21,035.
In terms of the costs of tuition and fees, specifically, you might be surprised at which types of schools increased the cost of college the most. Average tuition and fees for all four-year schools increased 3.6 times what they were in 1963, from $4,609 for the 1963-1964 school year to $16,647 for the 2019-2020 school year. Private institutions (for-profit and non-profit) increased their tuition costs and fees by more than 3.8 times their 1963 amount, from $8,430 to $32,769. Among public institutions, however, tuition and fees increased a jaw-dropping 4.6 times their 1963 value, skyrocketing from $2,029 to $9,349.
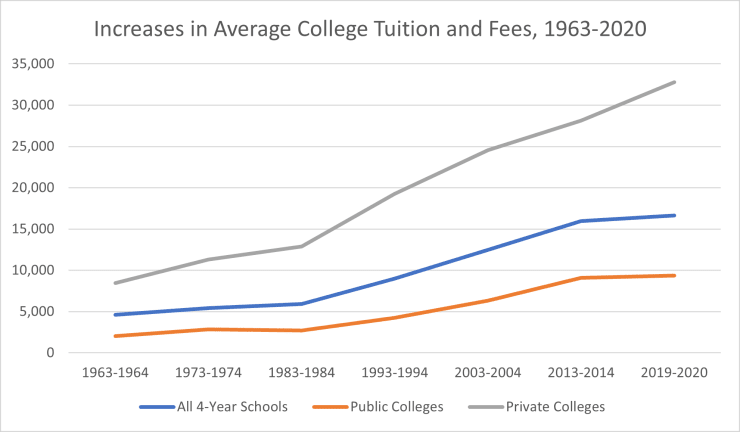
It is not only the tuition and fees themselves that have doubled (or tripled or even quadrupled) since 1963. The average cost of tuition and fees at all four-year colleges (public and private) in 1963 amounted to $4,609 (expressed in 2019 dollars), less than half of the total $10,727 cost for a year of college attendance. The combined costs of room and board-$2,324 and $3,794, respectively-amounted to more than the tuition and fees in 1963. In contrast, for the 2019-2020 academic year, the average cost of (in-state) tuition and fees at four-year schools rose to $16,647, while dormitory costs climbed to $6,878 and board costs reached $5,250-for a total average cost of $28,775.
College Tuition Inflation By the Numbers
All told, college prices have seen a 14-fold increase since 1960-nearly double the rate of consumer price inflation.
How We Calculate College Tuition Inflation: What Is the HEPI?
Before we dive into the numbers, the first thing to know is how tuition inflation is calculated. This calculation is expressed through a measure called the Higher Education Price Index (HEPI), which is compiled by asset management firm Commonfund Institute. Based on both government and industry data, the HEPI is considered a “more accurate” way of measuring inflation in the cost of college than the Consumer Price Index (CPI), which is used to measure inflation in the costs of consumer goods and services.
Both the HEPI and the CPI measure the cost and inflation of a “fixed market basket,” or a set of constant, common goods and services. The market basket used to calculate the HEPI is specific to the goods and services that colleges and universities purchase, while the market basket used in calculating the CPI consists of consumer products that are intended to represent the average spending of American consumers.
College Tuition Inflation Measures in the 1960s
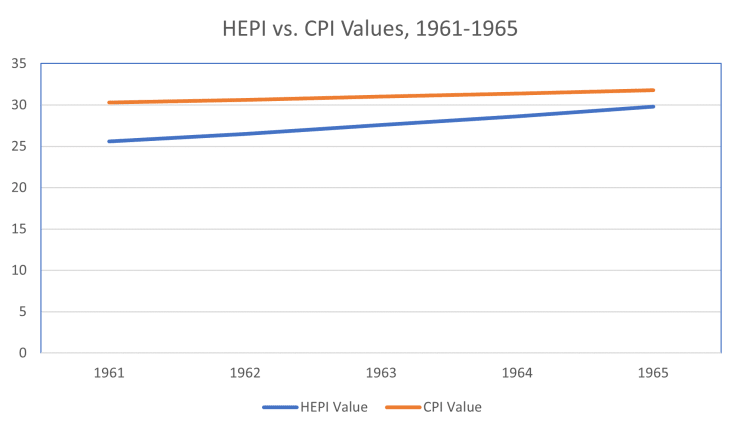
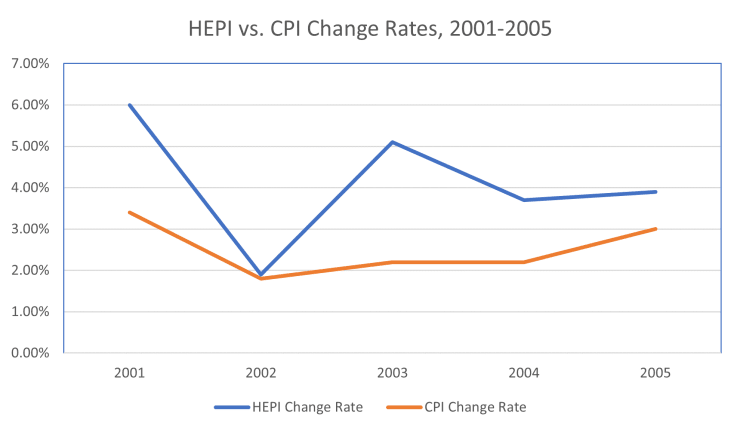
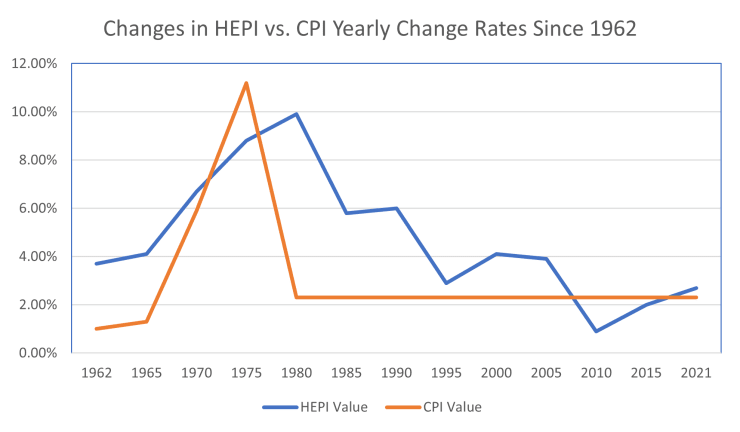
Tuition inflation rates have not always soared so far above other types of inflation rates. Believe it or not, in 1961, college operations costs were actually lower than consumer prices. The HEPI in 1961 was 25.6, compared to a CPI of 30.3.
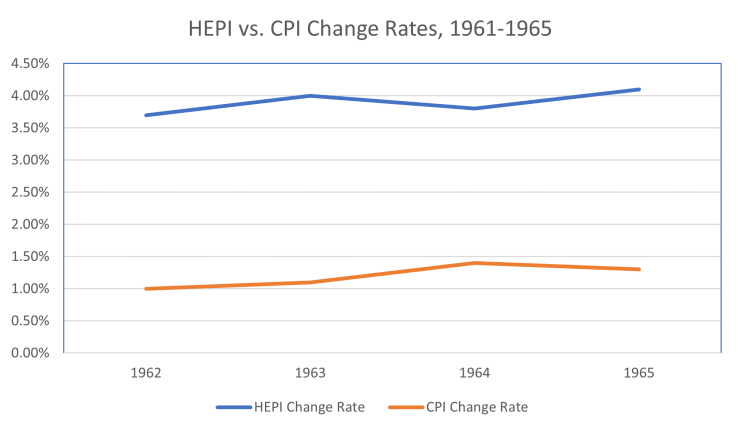
This discrepancy would not last long. Thanks to yearly change rates three times higher for the costs of colleges and universities than for consumers, the HEPI would soon overtake the CPI-and keep on climbing half a century later.
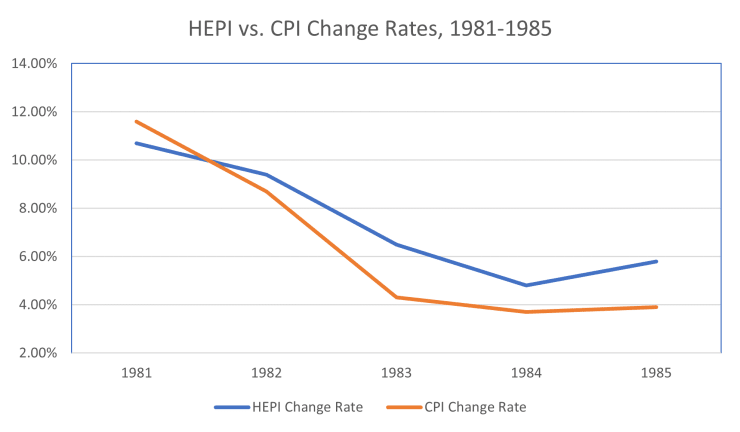
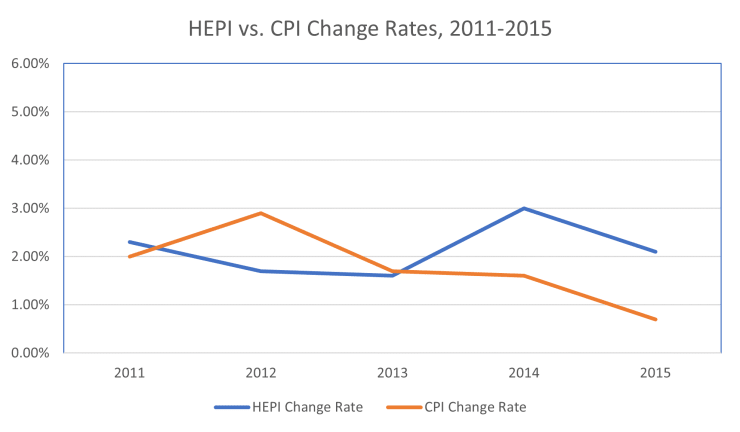
From 1961 through 1962, the CPI rose by only 1.0%, reaching 30.6, while the HEPI jumped by 3.7% to land at 26.5. Similar change rates throughout the first half of the decade would keep college costs on the path to outpacing consumer price inflation. While the CPI change rate increased modestly, by 1.1%, to a value of 31.0 between 1962 and 1963, the HEPI grew by 4.0% to reach 27.6. By 1964, a 1.4% CPI rate increase led to a CPI value of 31.4, while the 3.8% HEPI increase culminated in a value of 28.6. The middle of the decade saw CPI values at 31.8 and HEPI values at 29.8, with yearly increases of 1.3% and 4.1%, respectively.
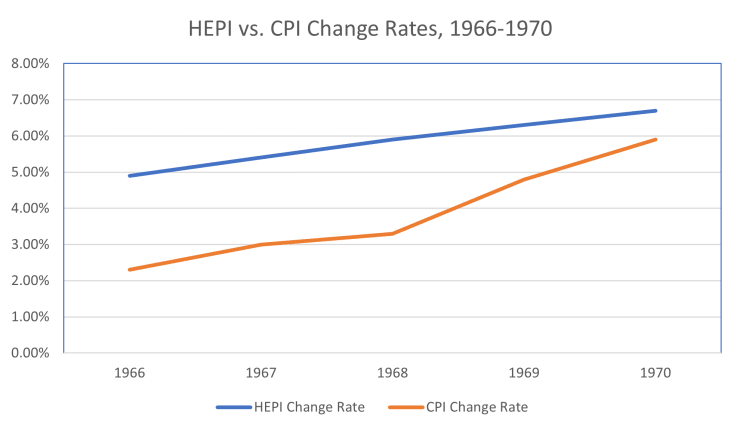
The mid-’60s saw a noticeable increase in the CPI yearly change rate, as well as the HEPI change rate. By 1966, the CPI change rate had risen to 2.3%, bringing the CPI value to 32.6, while a 4.9% HEPI change rate drove the HEPI value to 31.3. The following year, 3.0% CPI change rates and 5.4% HEPI change rates propelled values to 33.5 and 32.9, respectively.
Here’s where the tables turn. In 1968, a 3.3% yearly change rate puts the CPI value at 34.6. A 5.9% HEPI change rate pushes the HEPI value to 34.9, overtaking the CPI value for the first time in history.
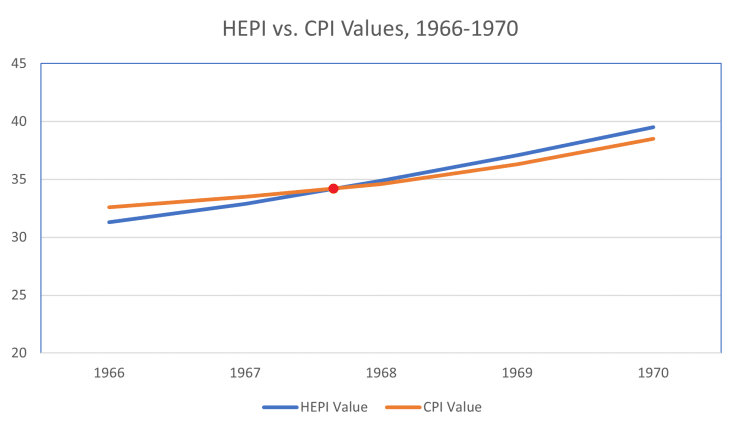
Change rates in both measures continue to climb. The 4.8% CPI change rate and 6.3% HEPI change rate of 1969 reached 5.9% and 6.7% in 1970, when CPI and HEPI values topped out at 38.5 and 39.5, respectively.
Inflation Rates Climb Throughout the 1970s
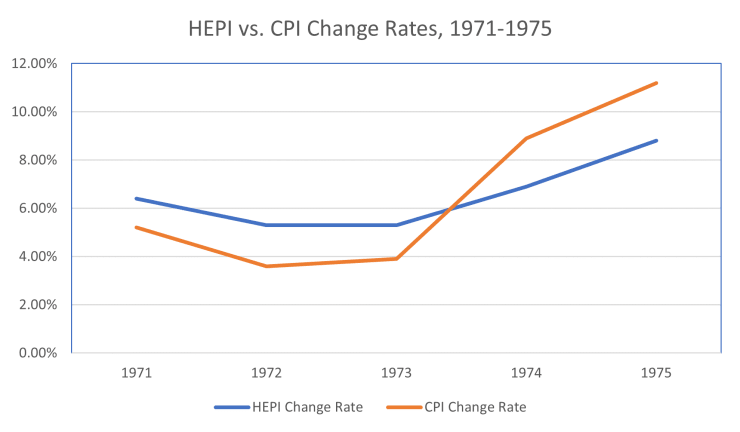
Through the early to mid-1970s, change rates were volatile, especially for the CPI. Between 1972 to 1975, the CPI yearly change rate more than tripled, from 5.2% to 11.2%, raising the CPI value from 41.9 to 52.8 in just a few years. The HEPI change rate increased at a more modest rate, from 5.3% in 1972 and 1973 to 6.9% in 1974 and 8.8% in 1975, with values increasing from 44.3 to 54.3.
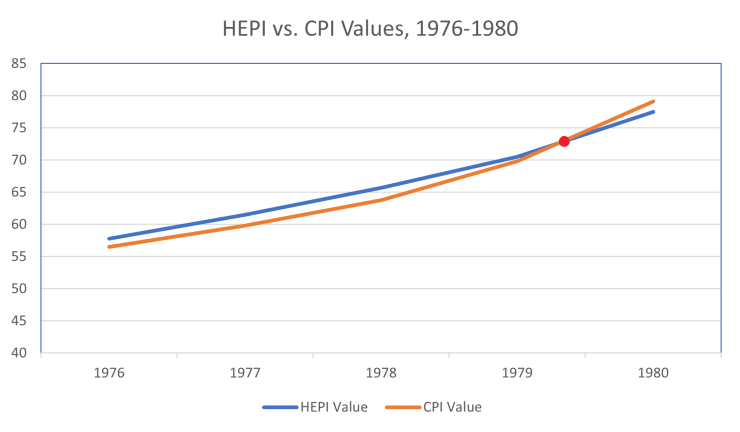
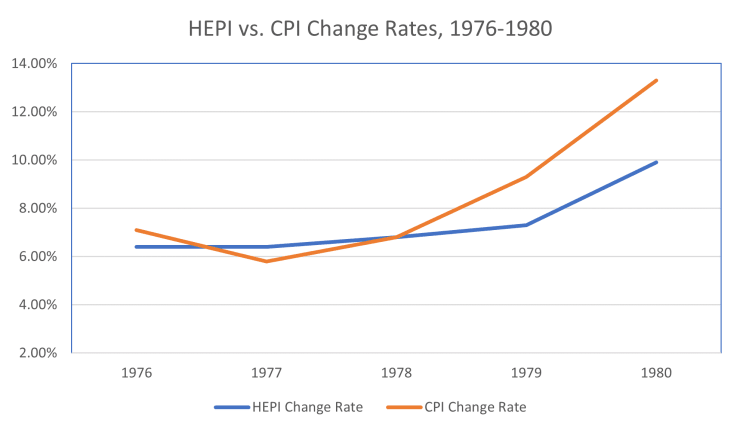
The yearly rate of inflation-both HEPI and CPI-dropped in the mid-70s only to reach (then) all-time highs in 1980. Despite the CPI change rate surpassing the HEPI change rate in 1976, at 7.1% compared to 6.4%, the HEPI value of 57.8 still exceeded the 56.5 CPI value.
CPI change rates dropped between 1976 and 1977, when they declined to 5.8%, and then rose to 6.8% the following year, and then rose to 9.3% in 1979. The HEPI change rate stayed fairly consistent during this time, lingering at 6.4% in 1977 and increasing by less than half of the amount by which the CPI change rate rose in 1978, when it reached 6.8. In 1979, the HEPI change rate was 7.3%, two whole percentage points below the CPI change rate.
By 1980, the CPI change rate had grown to 13.3% and the HEPI change rate rose to 9.9%. This discrepancy between the change rates of these two measures of inflation meant that the CPI value-79.1- overtook the HEPI value of 77.5.
College and Consumer Inflation Rates Level Out Again in the Early 1980s
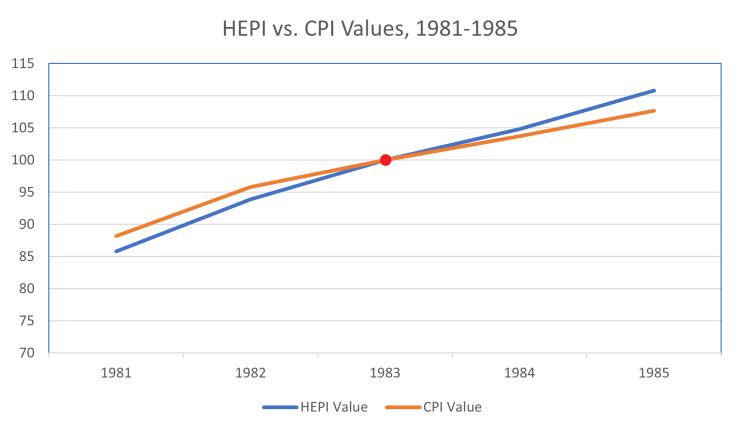
While the CPI value was still higher than the HEPI value in 1981-88.2 compared to 85.8-the 2.4 difference in value marked the largest amount by which the CPI had exceeded the HEPI since the ’60s, and the most by which the CPI would surpass the HEPI through to the present day. By 1983, decreasing change rates (that is, inflation rates that still went up for the year but not by as much as in previous years) caused the HEPI and CPI values to even out at 100.0. In 1984, the HEPI value would again overtake the CPI value-and this time, it would stay that way.
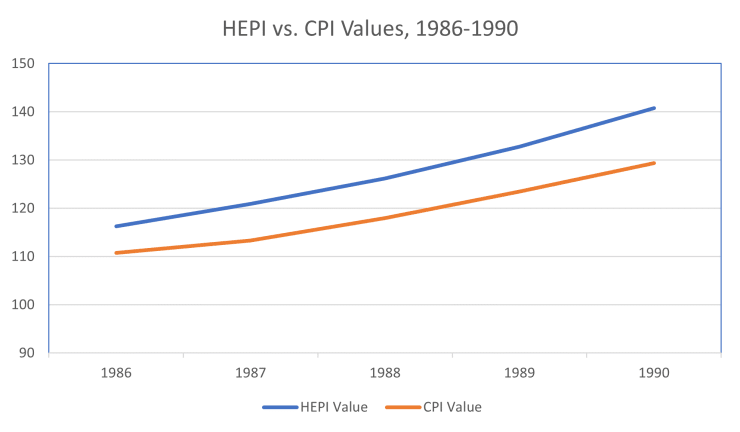
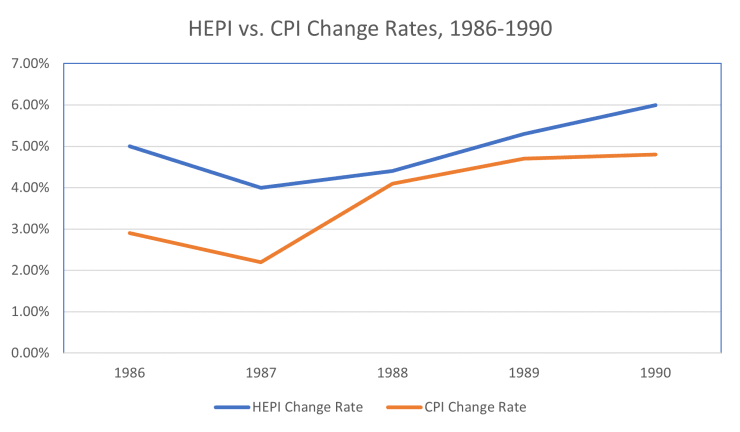
Despite more modest change rates, the gap between the HEPI and CPI values widened throughout the second half of the 1980s. By 1990, the HEPI value (140.8) outstripped the CPI value (129.4) by more than 10 points, amounting to a difference of almost 8%.
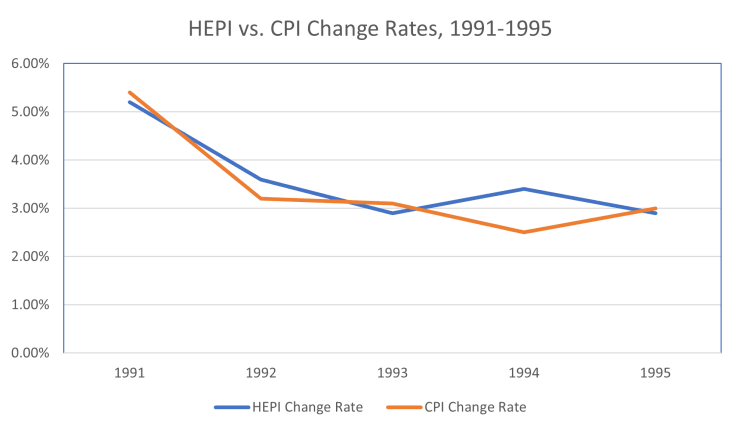
The Gap Between HEPI and CPI Values Widen in the 1990s
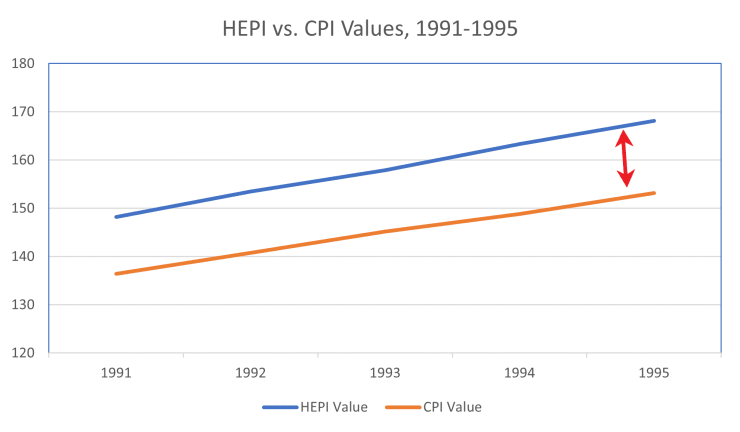
Through much of the early 1990s, the differences between the HEPI change rates and the CPI change rates were modest, and which rate was higher than the other in any given year flip-flopped. However, that did not stop the gap between CPI and HEPI values from continuing to widen. By 1995, The difference between the HEPI value and the CPI value had grown to nearly 15 points.
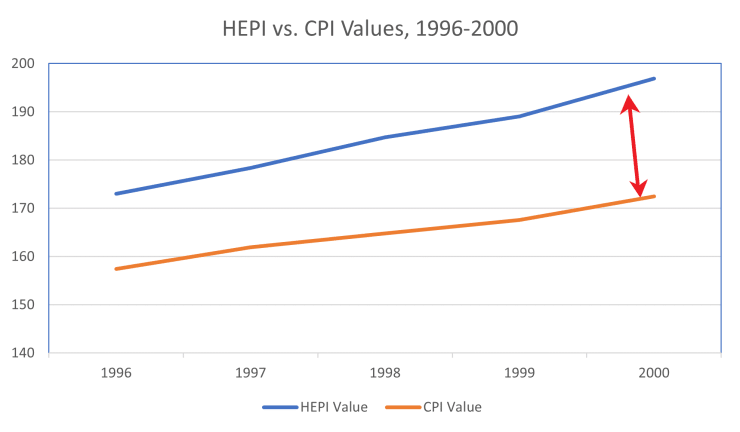
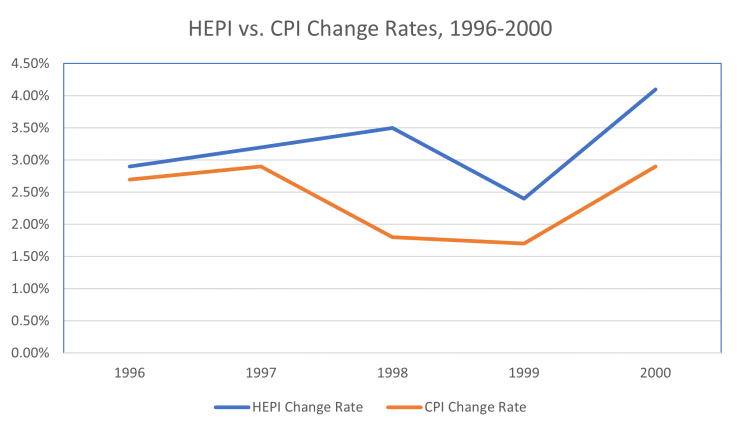
Throughout the second half of the 1990s, HEPI change rates were slower to decline and quicker to rise than CPI change rates. In 1998, the HEPI change rate climbed to 3.50%, almost twice the CPI change rate, which had dropped considerably from the previous year down to 1.80%. As a result, the difference between the CPI value and the HEPI value-now on the cusp of breaking 200-amounted to more than two dozen points. The HEPI value had effectively doubled from 1983 to 2000.
Despite Decreasing Yearly Change Rates, the HEPI Rockets Upward Throughout the 2000s
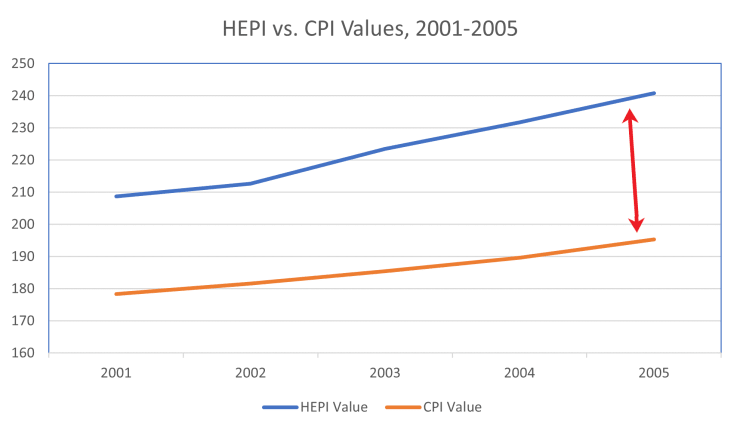
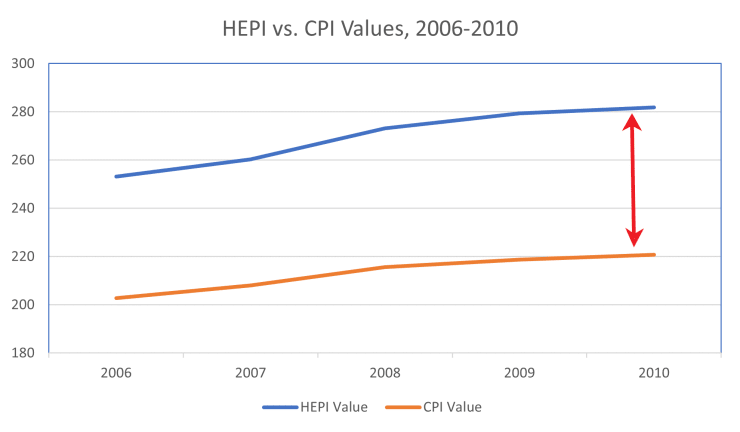
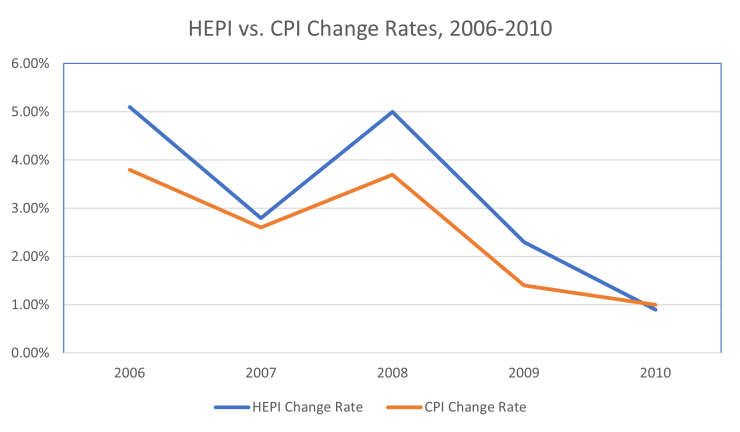
The start of the new millennium would see the HEPI value continue to greatly surpass the CPI value. Despite the HEPI change rate hitting a historical low of 1.9% in 2002, by 2005, the HEPI value had exceeded the CPI value by more than 45 points.
Yearly change rates for both CPI and HEPI plummeted during the later half of the 2000s decade, and in 2010, the CPI change rate was 1.0% and the HEPI change rate was 0.9%-marking the lowest rate of increase in history (and remaining such even today).
Yet the HEPI value was already so large that every tenth of a percentage point still drove this figure farther out of control. By 2010, the HEPI value had climbed to 281.8, more than 60 points above the CPI value.
The 2010s and Start of 2020s: The HEPI Value Surpasses the CPI Value by Nearly 100 Points by 2021
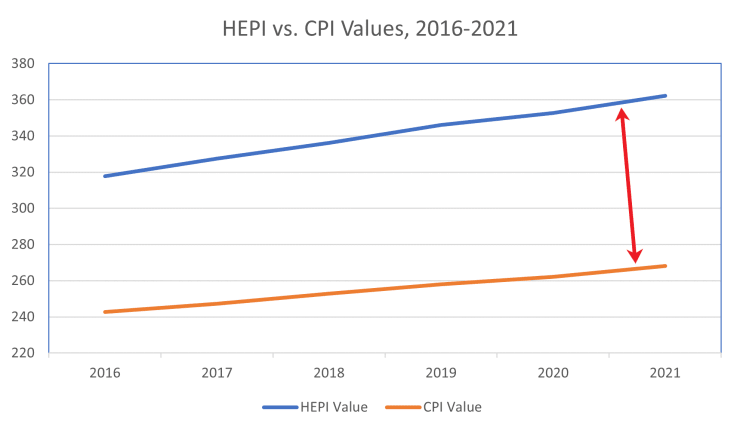
Despite relatively low rates of yearly change in both CPI and HEPI in the first half of the 2010s, the HEPI value swelled above 300 in 2014. By 2015, the HEPI value exceeded the CPI value by more than 70 points.
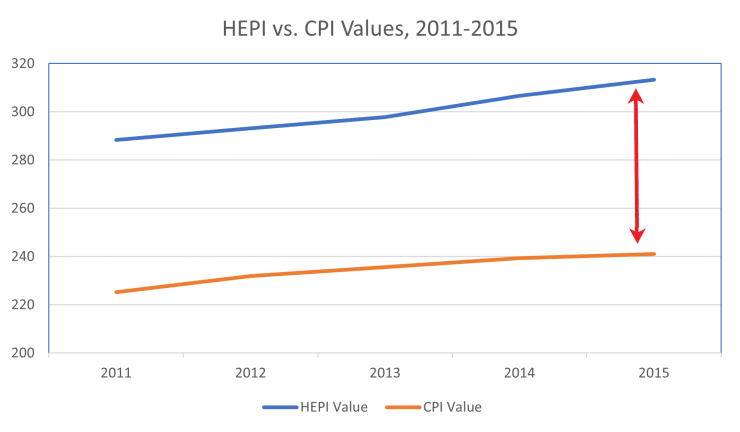
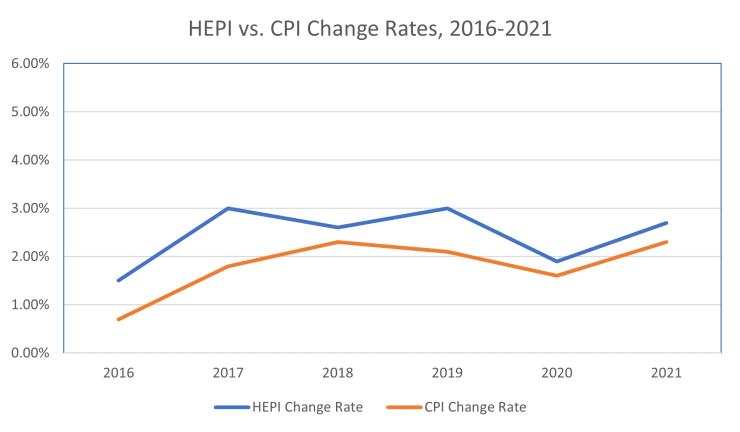
In 2016, the yearly increase in the HEPI inflation rate was more than double that of the CPI yearly change rate, at 1.5% and 0.7%, respectively. Throughout the end of the decade, the HEPI continued to rise by amounts above the CPI rate of change. Even during years when the differences in change rates were modest, the difference in values only became more pronounced. By 2021, the HEPI value exceeded the CPI value by more than 90 points.
Looking at the Whole Picture of HEPI vs. CPI Inflation in the Last 60 Years
Broken down into chunks as small as half a decade, each set of data tells only one chapter of the story-spanning 60 years-of how college tuition inflation has pushed the cost of college to the extreme and created a student loan crisis. A broader view shows just how much more steeply college tuition inflation, as measured by HEPI value, has increased compared to the inflation of consumer prices.
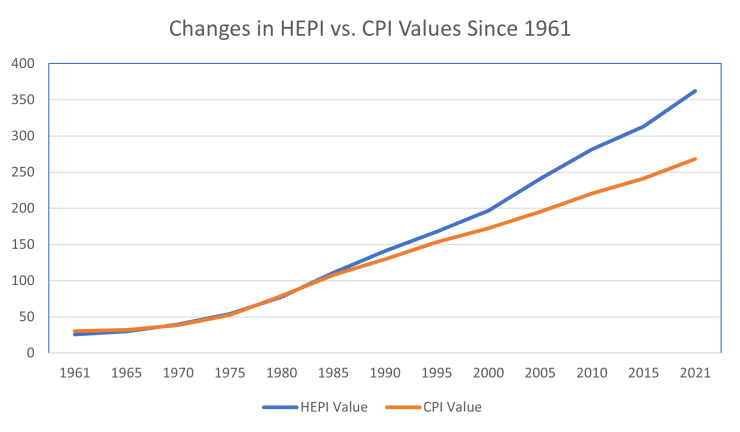
A look at the yearly change rates since 1962 shows how we got here. With the exception of one exceptionally high spike in the CPI yearly change rate in 1975 and a record-breaking dip in the HEPI change rate in 2010, the HEPI yearly change rate has been consistently higher-often, much higher, even two, three, or up to four times as high-compared to the CPI change rate.
Putting College Tuition Inflation in Perspective
To really put into context how the cost of college attendance over the years has grown in relation to earnings, we need to compare these costs to meaningful benchmarks. Below we will explore the average cost of college attendance during each decade compared to the median family income and the yearly earnings of a full-time minimum-wage worker.
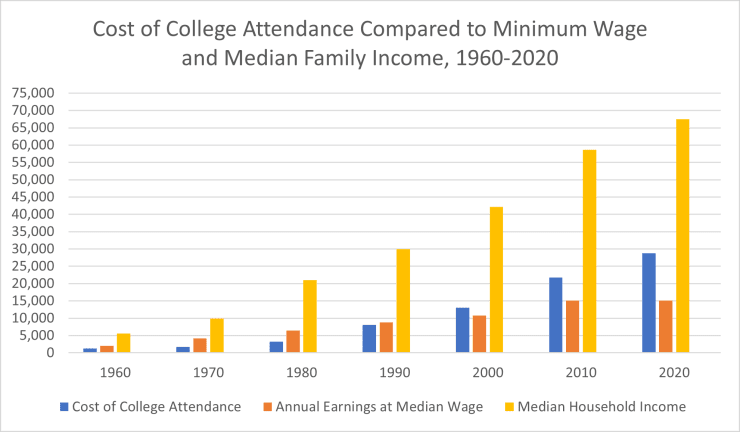
1960s
In the 1960s, when the average nominal cost of college at a four-year institution was around $1,227 ($10,727 in 2019 dollars) and the federal minimum wage was $1, the median family income was just $5,600 (1960, reported by the Census Bureau). The Census Bureau reported a median home value of $11,900.
1970s
In 1970, the average family income had risen to a nominal amount of $9,870, according to the Census Bureau. The federal minimum wage increased to $2 in 1974, according to the U.S. Department of Labor, which raised the full-time yearly earnings of minimum-wage workers to $4,160. The median home value in the United States in 1970 was $17,000. The average cost of college at a four-year institution for the 1970-1971 school year was $1,717.54 ($11,554 in 2019 dollars).
1980s
By the 1980s, the Census Bureau was reporting a nominal median family income of $21,020, and full-time workers earning the federal minimum wage-$3.10 per hour-could expect to earn $6,448 in a year. The median home value was now up to $47,200. As expressed in 2019 dollars, the cost of college attendance as of 1980 actually decreased slightly, down to $10,391, but the high rates of inflation put that dollar amount in nominal (1980) dollars at $3,238.92.
1990s
As of 1990, the nominal median family income was $29,943 (as reported by the Census Bureau). From 1991 to 1997, the federal minimum wage of $4.25 would increase by nearly a dollar, translating to $8,840 over a year of full-time work. The median home value was up to $79,100. As expressed in 2019 dollars, the average cost of college at a four-year school in 1991 was $15,332, which equated to $8,054.59 in unadjusted (1991) dollars.
2000s
In 2000, the Census Bureau reported a nominal median family income of $42,148. The federal minimum wage of $5.15 (as of 1997) would amount to $10,712 over the course of a year (and, by the end of the decade, would climb to more than $7 per hour). The median home value reached $119,600 in 2000. The average cost of college attendance for the 2000 through 2001 academic year, $18,985 as expressed in 2019 dollars, was $13,017.49 in 2000 dollars. For the first time, the cost of a year of college now exceeded the entire year’s worth of earnings for full-time minimum-wage workers.
2010s
While the nominal median household income rose to $58,627 in 2010, full-time workers making the federal minimum wage in 2010, $7.25, were earning $15,080 over the course of a year. The median home value increased to $221,800 as of 2010.
The $25,682 average cost of college for the 2010 through 2011 school year-as expressed in 2019 dollars-amounted to $21,750.06 in 2010 dollars.
2020s
For 2020, the Census Bureau reported a median household income of $67,521, and CNBC reported that the median home value had reached $310,600. The federal minimum wage remained the same as it had since 2009: $7.25 per hour, or $15,080 for a year of full-time work. For the 2019-2020 school year, the National Center for Education Statistics reported the average cost of attendance at a four-year college as $28,775.
What’s Driving the Education Inflation Rate?
Why has the cost of college increased at almost double the rate by which the CPI has risen? As you might expect, there is no single culprit that has led us to this place of college unaffordability. Instead, there are a multitude of factors that, together, create the complex web in which college costs are continually skyrocketing.
Demand for a College Degree
Back when the cost of a college education began rapidly trending upward in 1960, TIME reported that college enrollment numbers were “surging” and were expected to double over the next decade.
Almost half of all Americans between the ages of 18 and 21 were expected to attend college in 1960, according to TIME. That is a far cry from college enrollment rates a decade earlier, when only 30% of 18- and 19-year-old Americans and just 9% of 20- to 24-year-olds were in school (college), according to the National Center for Education Statistics. Nowadays, nearly two-thirds of high school graduates (66% of 2019 high school graduates, according to the National Center for Education Statistics) immediately enroll in either a two-year or four-year college institution.
It is easy to see why the demand for a college education has risen consistently in recent decades. According to sources like The Chronicle of Higher Education and the Georgetown Public Policy Institute, an estimated two out of three job opportunities now require some level of formal education or training beyond a high school diploma. It is no coincidence that the jobs that require a college education are largely considered “better” jobs by several metrics, ranging from earning potential and benefits to prestige. Thanks to the phenomenon of “degree inflation,” as the BBC reported, workers today often need higher levels of education than workers in previous generations performing the same jobs.
A massive increase in student populations may sound like a boon for the college industry, but higher enrollment numbers also lead to higher operating costs, ranging from the physical space of classrooms, dormitories, and parking lots to the faculty and staff needed to teach more classes and manage more complex administrative work. Financing the resources needed to accommodate more students means charging more money.
Geographic Factors in Proximity and Cost of College Institutions
It is difficult to truly explore college costs without factoring in geography. Public institutions, even at the community college level, often offer separate tuition rates to in-state or in-district students and nonresident students.
The obvious recommendation to stay in-state to take advantage of discounted tuition is not always pragmatic, and depending on the state, this advice may not offer the savings students would hope. The cost of in-state tuition at public colleges varies considerably by state. For the 2021-2022 academic year, the average cost of in-state tuition and fees at four-year schools ranged from just $6,100 in Wyoming to more than $17,000 in New Hampshire and Vermont, according to the College Board. Students typically can save money by studying in-state, but those who happen to live in the most expensive states will pay almost three times more than those living in the states with the lowest in-state college costs.
Additionally, not all geographical regions have easy access to colleges. About 3.5% of American adults, or 11.2 million people, live in what The Chronicle of Higher Education referred to as an “education desert”—a geographic region more than a 60-minute drive from the closest public college. In many areas, even students who live within an hour’s drive of one public college may not live in close enough proximity to consider more than one school. This makes “shopping around” for an affordable school nearly impossible for students who cannot afford to travel or who have other professional or personal obligations limiting their ability to move for school.
Unclear Pricing Practices That Make It Difficult to Compare Costs
Even for students who can shop around, comparing college costs is a difficult feat. College costs are not expressed in standardized ways. One school might give tuition rates for a year, while another provides them for one semester only or by the course or credit. Fees may or may not be included.
More importantly, prospective students cannot easily quantify the true cost of college after including financial aid packages. Some aid is awarded by the institution, some by the federal government, some by state or local governments, and some by outside organizations that sponsor scholarships or offer employee tuition benefits. In certain instances, being awarded a merit-based scholarship for their hard work and ambition can cause need-based aid to be reduced, making the extra work of pursuing merit-based scholarships a wash.
Calculating what students will actually pay even at one institution is challenging enough. Putting a concrete dollar amount on the actual cost of college at multiple schools-a critical step in being able to compare costs and make an informed and financially-savvy enrollment decision-is nearly impossible.
This lack of transparency allows colleges to more easily hide tuition hikes or at least obscure just how much more above the CPI rate of inflation their costs are climbing year after year.
Government Factors in College Costs
Government factors, too, have affected how the cost of college has changed.
At the state level, declines in funding have forced colleges to either raise the costs to students or slash their expenses-at a time when enrollment has risen.
Financial aid from the federal government has, for individual students, put degrees in reach that would otherwise be prohibitively expensive to pursue. However, experts have warned that financial aid programs through the federal government have not only failed to fix the problem of skyrocketing college costs but that these programs may, in fact, be having the opposite effect on college costs. While sources like NPR took a middle-of-the-road viewpoint of the issue, concluding that there was no definitive evidence that federal aid is driving up costs across all types of schools,
Forbes reported that every dollar of additional federal funding in the form of subsidized loans was associated with an increase of $0.65 on the “sticker price” of college enrollment.
Finally, government regulations on colleges have expanded since the early 1960s. These regulations have aimed to help students in many ways, from protecting them against violence and discrimination to disclosing institutional and program data needed to make smart decisions about pursuing a college education. However, they also come with costs. For example, in 2015, Vanderbilt University famously reported spending a whopping $150,000,000-more than 10 percent of its total annual budget-on compliance with government regulations, according to The Hechinger Report.
Labor Shortages and College Salaries
Certainly, a big portion of college costs fit into the category of labor costs-the salaries and benefits packages of professors, administrators, and other staff responsible for a college’s operations, which contributes to administrative bloat.
Most people have mixed feelings about employment salaries as a factor in driving up college costs. On one hand, it is easy to say that higher education, as an industry, should do all it can to keep the cost of college down. On the other hand, viewing colleges as employers means acknowledging that these institutions have a responsibility to pay their workers-many of whom are, by no coincidence, well-educated and highly qualified-reasonable and livable wages. Colleges absolutely count as employers; as of 2022, this industry employed more than 3,000,000 Americans, according to industry research company IBISWorld.
Without professors willing to teach, colleges could not serve their purpose of educating students in the first place. It is worth noting, too, that professors often do not command lucrative salaries, especially considering that they typically need at least a master’s degree, if not a Ph.D., to qualify for the role.
For 2021, the United States Bureau of Labor Statistics (BLS) reported a median annual salary of $79,640-but there are caveats. Pay rates for professors at junior colleges tend to be lower, and postsecondary teachers working at state-run junior colleges reported a considerably lower median salary of $63,590. Further, the BLS reported that the difference in annual earnings between the highest earners in the field (postsecondary teachers at or above the 90th percentile) and the lowest earners (at or below the 10th percentile) amounted to nearly $110,000. While some postsecondary teachers enjoyed salaries that were well into the six-figure range at the time of the report (2014), others were scraping by with incomes in the range of $20,000 per year.
The trend of hiring adjunct college professors in place of full-time faculty members adds to this problem, keeping more postsecondary teachers on the lower end of the payscale. Adjuncts are not on the tenure track and are typically categorized as “part-time”- despite teaching course loads that are often not much less rigorous than their full-time counterparts. According to a 2020 report by Inside Higher Ed, many adjuncts earn less than $3,500 per course-with almost a third of adjuncts surveyed saying they make less than $25,000 per year. Many adjuncts technically “live in poverty.” It is hard to argue that teachers earning less than $25,000 per year (with a master’s degree or even a doctorate) are overpaid or that their salaries are the problem behind college tuition inflation.
Faculty salaries are not growing by leaps and bounds. In 2015, the average salary of full-time professors increased by 2.0%, and in 2018, professors saw an average salary boost of just 1.3%, according to the Commonfund Higher Education Price Index update. That is way less than the year-over-year salary increases awarded in the ’70s, ’80s, and ’90s, and it is generally not always even enough to keep pace with consumer price inflation. More critical words could be said about the cost increases pertaining to non-faculty salaries. Administrative expenses and administrators’ salaries often drive up the cost of college education without necessarily offering any direct benefits to the students who have to pay for them.
The Need for Colleges to Provide Additional Services and Support
One positive reason college costs more now is because colleges today are providing more support services to students-and for good reason.
There is a mental health crisis on college campuses. A 2020 study by the Healthy Minds Network found that nearly 40% of college students surveyed suffered from some type of depression. Further, over a third of respondents reported having an anxiety disorder, more than 20% reported non-suicidal self-harm, and both eating disorders and suicidal ideation were reported by more than one in ten students.
To keep students safe and give them the best chance to thrive, colleges and universities have to take action, most commonly by expanding and enhancing the counseling and mental health treatment services available to students. This costs money-a lot of money-but it is worth it. As of 2015, Psychology Today estimated that mental health treatment and prevention accounted for $1 in every $400 of institutional expenditures.
Often, much of this cost is covered by campus fees charged to all students. For example, for the 2020-2021 school year, California State University reported spending $45,000,000 on mental health services for students, with campus fees covering $30,000,000 of this spending, according to the California Legislature’s Nonpartisan Fiscal and Policy Advisor.
Mental health on college campuses actually was a topic of concern and conversation in the 1960s, as an article published in the Journal of American College Health reported, but it was certainly not the matter of importance that college presidents across the board are paying attention to today. It also was not as big a factor in college costs. In fact, 70% of college presidents surveyed in 2019 reported allocating additional funding to student mental health services just in the past three years, according to Higher Education Today.
The Impact of General Inflation on College Costs
College tuition inflation may have increased at nearly double the rate of consumer price inflation, but college operations are not immune to the effects of “regular” inflation. Increases in the costs of utilities make powering a campus more expensive, and those costs are passed onto the students. The same cost increases in the prices of food products and packaging that affect the restaurant industry also factor into higher costs for college students’ meal plans (board).
Inflation in the cost of consumer products is not the primary reason the cost of college has soared-if it was, the difference between the CPI and the HEPI would be considerably less-but these financial strains are not negligible, either.
The number and complexity of the factors that affect college tuition inflation also make out-of-control college costs a particularly stubborn problem. Effectively curbing college costs means addressing the diverse and often interrelated factors that influence tuition rate hikes, compounding fees, and spiraling room and board costs.
Inflated College Costs Lead to Swelling Student Loan Debts
College tuition inflation hits consumers hard. While every family is not incurring college tuition costs every year, as with inflated consumer products like food and housing, the massive expense of a college education can lead to long-term debt.
In 2022, the total amount of student loan debt in the United States is $1.6 trillion-up 168% from the $948.2 billion reported just 10 years earlier, according to The Atlantic. Where the 38.3 million borrowers carried an average student debt amount of $24,700 in 2012, they now number 43.4 million and are sinking underneath an average debt balance of $36,800.
Students can spend decades paying off the degree that took them four years to earn. In the meantime, student debt hinders consumers’ ability to accrue emergency savings, buy a home, raise capital to start a business, save for retirement, and meet other financial goals.
College Savings: What College Tuition Inflation Means for the Future of Planning for College
For college graduates who go on to raise families of their own, planning for future education costs for their children adds to the burden. Too many Americans are feeling the squeeze of trying to finally pay off their own student debt while starting to save for their children’s college fund early enough to take advantage of the benefits of compound interest.
Starting college savings efforts early is critical, and for many families, it is still nowhere near enough. As we have seen, the cost of college grows at rates that can far outstrip other measures of inflation and which are not always predictable. Still, estimates of future college costs can be projected based on past data, and those estimates are discouraging. According to Vanguard’s College Cost Calculator (as of May 2022), the cost of a year of college at a four-year, in-state public school will rise to $28,959 in five years, $36,960 in 10 years, $47171 in 15 years, and $60,203 in 20 years.
Whether you are trying to pay down student loans, plan for your child’s educational future, or you are trying to manage the cost of going back to school yourself, you will be impacted by tuition inflation. If the past 60 years have been any indication, the cost of college will likely continue to surge over the next couple decades.
Learn more with a look at our Guide to the College Admissions Process.
Or get tips on studying, student life, and much more with a look at our Student Resources.